Plotting examples#
Plotting real world radar data with Py-ART.
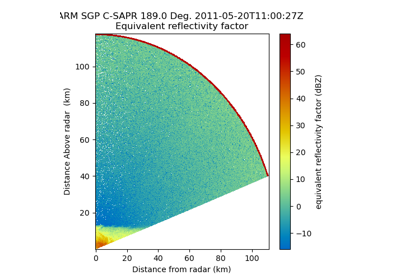
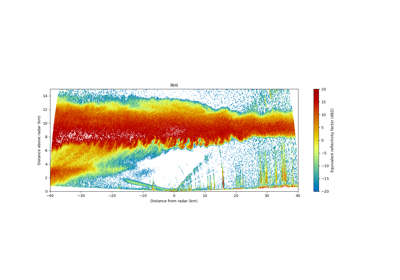
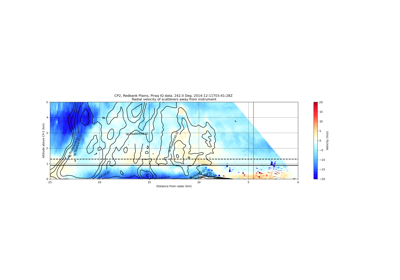
sphx_glr_examples_plotting_plot_rhi_mdv.py
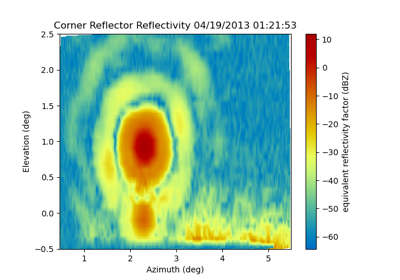
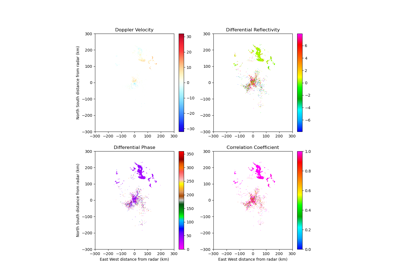
sphx_glr_examples_plotting_plot_corner_reflector.py
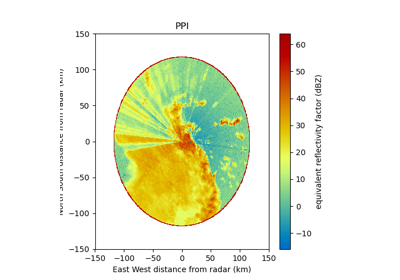
sphx_glr_examples_plotting_plot_ppi_mdv.py
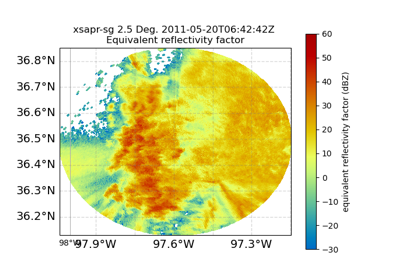
sphx_glr_examples_plotting_plot_ppi_cfradial.py
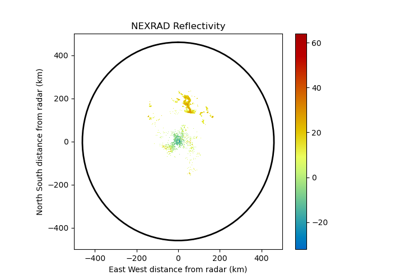
sphx_glr_examples_plotting_plot_nexrad_reflectivity.py
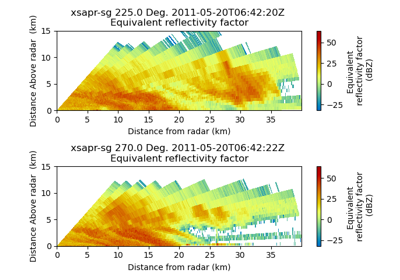
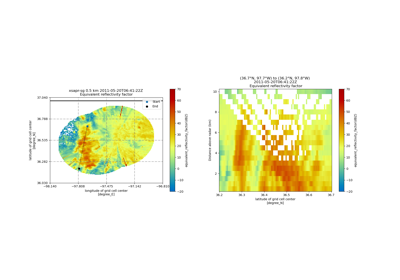
sphx_glr_examples_plotting_plot_xsect.py
sphx_glr_examples_plotting_plot_rhi_cfradial_singlescan.py
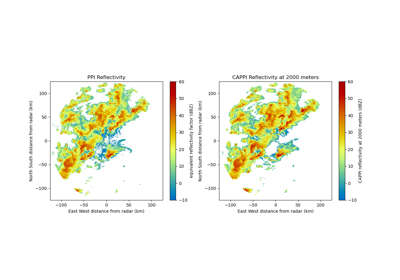
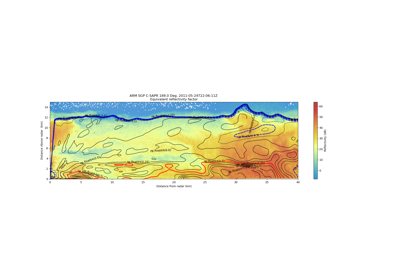
sphx_glr_examples_plotting_plot_cappi.py
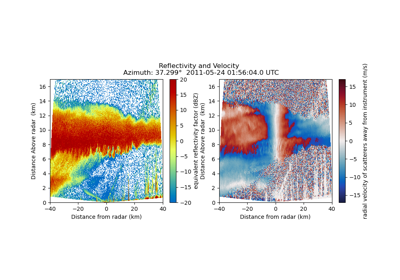
sphx_glr_examples_plotting_plot_rhi_two_panel.py
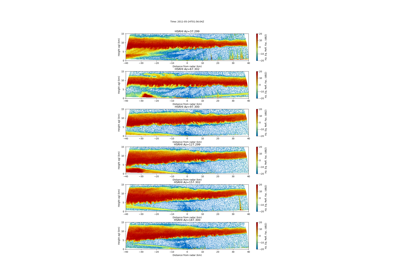
sphx_glr_examples_plotting_plot_nexrad_multiple_moments.py
sphx_glr_examples_plotting_plot_rhi_cfradial.py
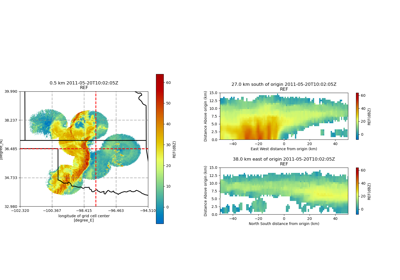
sphx_glr_examples_plotting_plot_three_panel_gridmapdisplay.py
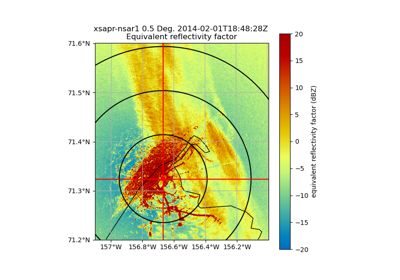
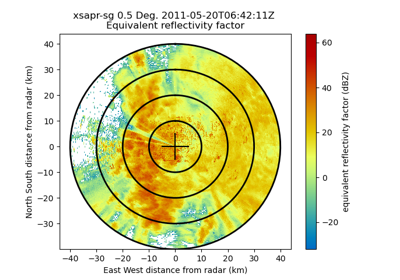
sphx_glr_examples_plotting_plot_ppi_with_rings.py
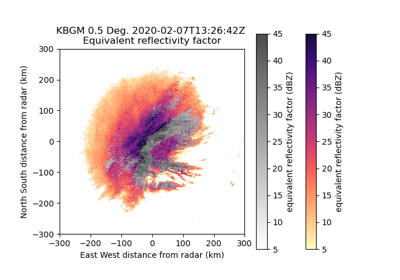
sphx_glr_examples_plotting_plot_nexrad_image_muted_reflectivity.py
sphx_glr_examples_plotting_plot_rhi_data_overlay.py
sphx_glr_examples_plotting_plot_cross_section.py
sphx_glr_examples_plotting_plot_modify_colorbar.py
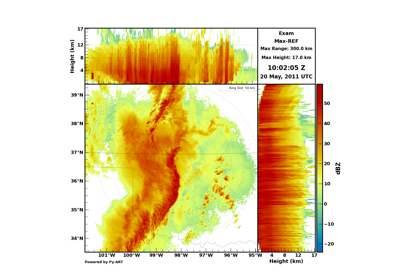
sphx_glr_examples_plotting_plot_max_cappi.py
sphx_glr_examples_plotting_plot_rhi_contours_differential_reflectivity.py
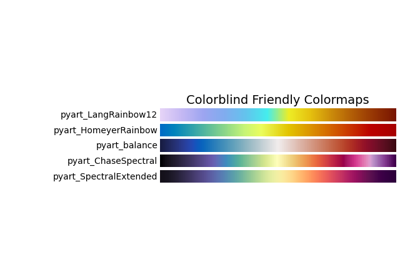
sphx_glr_examples_plotting_plot_choose_a_colormap.py