Example Gallery#
The files used in these examples are available for download.
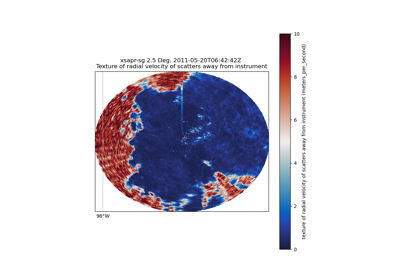
Moment correction examples#
Performing radar moment corrections in antenna (radial) coordinates.
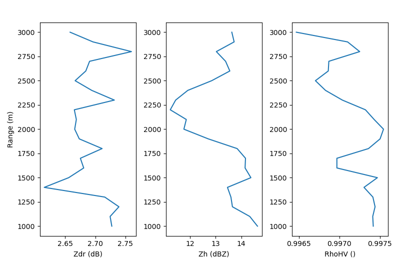
sphx_glr_examples_correct_plot_zdr_check.py
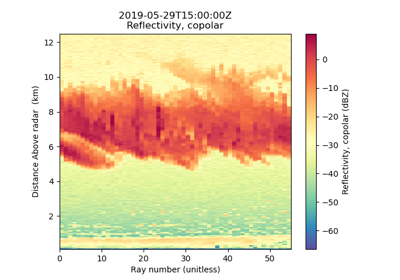
sphx_glr_examples_correct_plot_cloud_mask.py
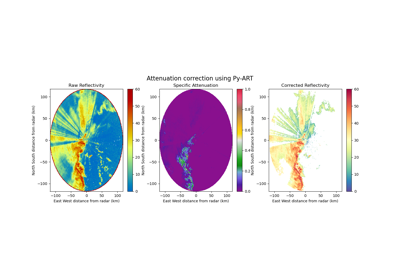
sphx_glr_examples_correct_plot_attenuation.py
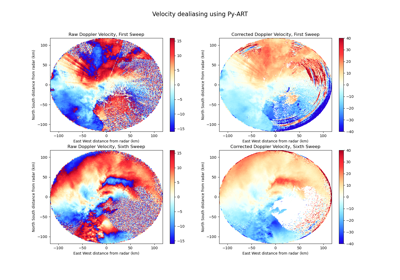
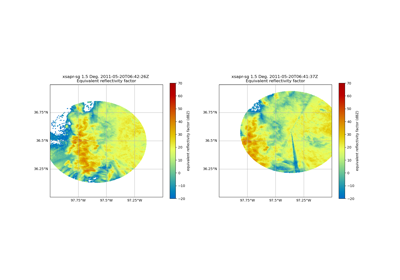
sphx_glr_examples_correct_plot_dealias.py
Input/Output Examples#
Reading/writing a variety of radar data using Py-ART.
sphx_glr_examples_io_plot_older_nexrad_data_aws.py
sphx_glr_examples_io_plot_nexrad_data_aws.py
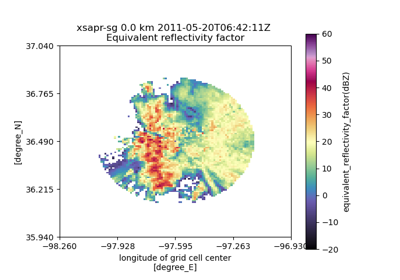
Mapping examples#
Mapping one or multiple radars from antenna coordinates to a Cartesian grid.

sphx_glr_examples_mapping_plot_map_one_radar_to_grid.py
sphx_glr_examples_mapping_plot_map_two_radars_to_grid.py

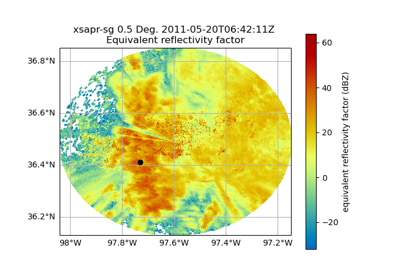
sphx_glr_examples_mapping_plot_grid_single_sweep_ppi.py
sphx_glr_examples_mapping_plot_compare_two_radars_gatemapper.py
Plotting examples#
Plotting real world radar data with Py-ART.
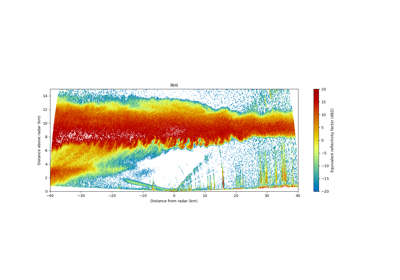
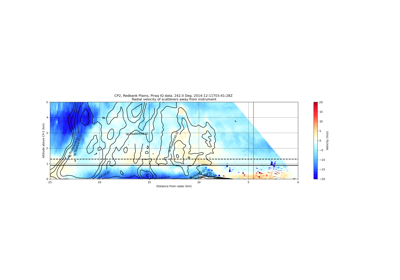
sphx_glr_examples_plotting_plot_rhi_mdv.py
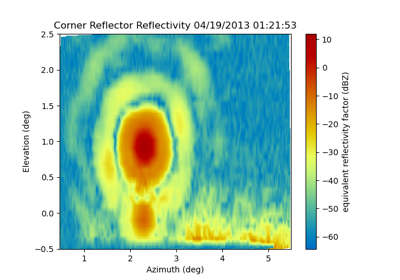
sphx_glr_examples_plotting_plot_corner_reflector.py
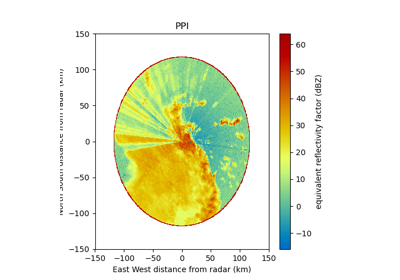
sphx_glr_examples_plotting_plot_ppi_mdv.py
sphx_glr_examples_plotting_plot_ppi_cfradial.py
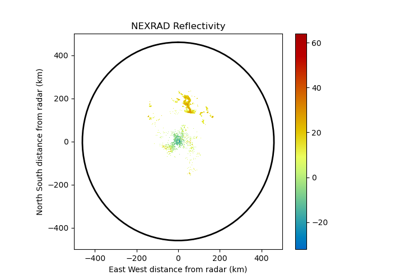
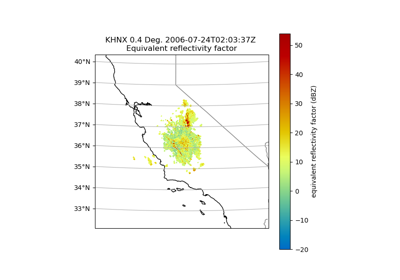
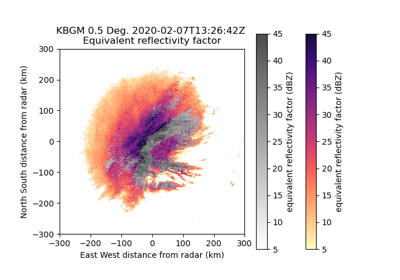
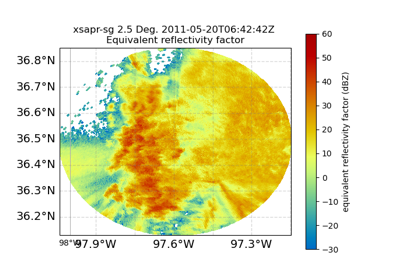
sphx_glr_examples_plotting_plot_nexrad_reflectivity.py
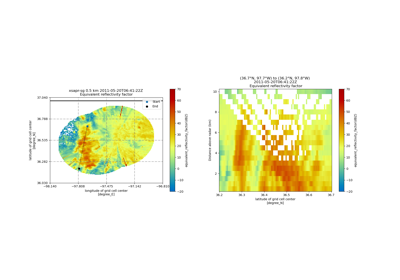
sphx_glr_examples_plotting_plot_xsect.py
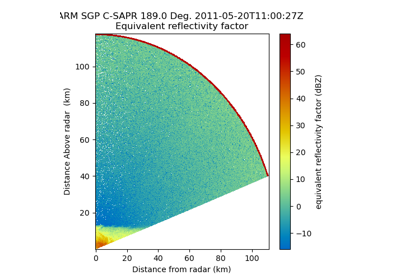
sphx_glr_examples_plotting_plot_rhi_cfradial_singlescan.py
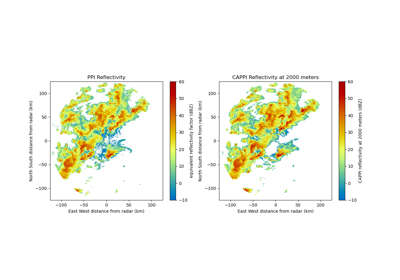
sphx_glr_examples_plotting_plot_cappi.py
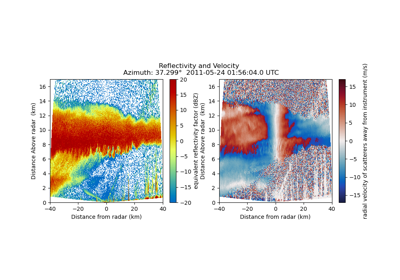
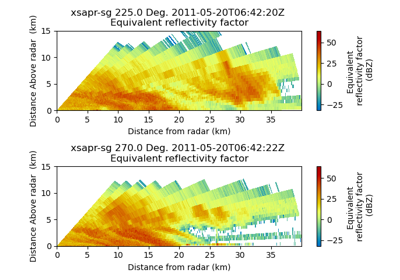
sphx_glr_examples_plotting_plot_rhi_two_panel.py
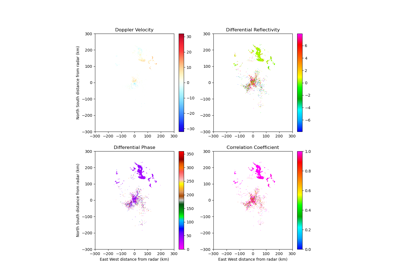
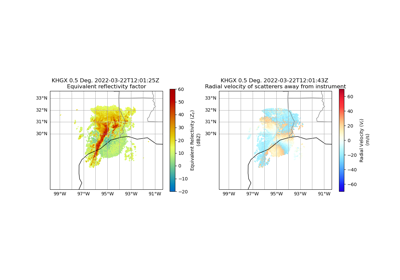
sphx_glr_examples_plotting_plot_nexrad_multiple_moments.py
sphx_glr_examples_plotting_plot_rhi_cfradial.py
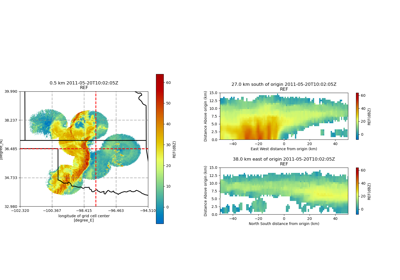
sphx_glr_examples_plotting_plot_three_panel_gridmapdisplay.py
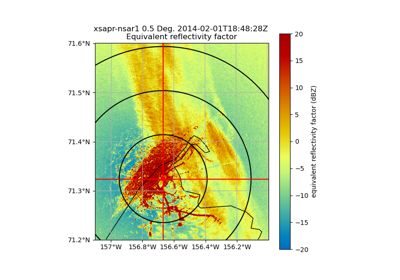
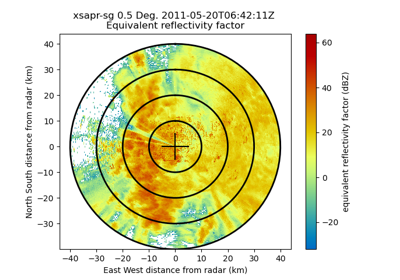
sphx_glr_examples_plotting_plot_ppi_with_rings.py
sphx_glr_examples_plotting_plot_nexrad_image_muted_reflectivity.py
sphx_glr_examples_plotting_plot_rhi_data_overlay.py
sphx_glr_examples_plotting_plot_cross_section.py
sphx_glr_examples_plotting_plot_modify_colorbar.py
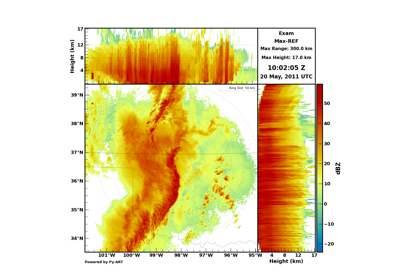
sphx_glr_examples_plotting_plot_max_cappi.py
sphx_glr_examples_plotting_plot_rhi_contours_differential_reflectivity.py
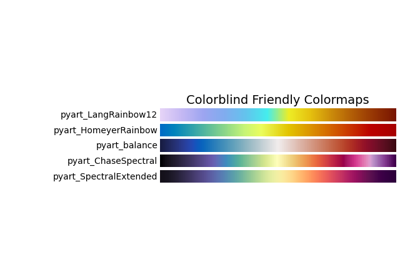
sphx_glr_examples_plotting_plot_choose_a_colormap.py
Retrieval Examples#
Retrievals from various radars, such as additional fields or subsets of the data.
sphx_glr_examples_retrieve_plot_column_subset.py
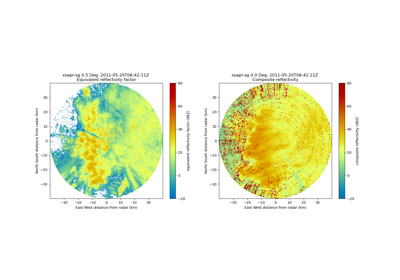
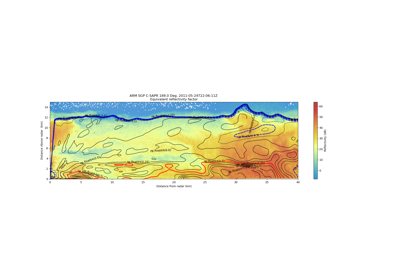
sphx_glr_examples_retrieve_plot_composite_reflectivity.py

sphx_glr_examples_retrieve_plot_vad.py
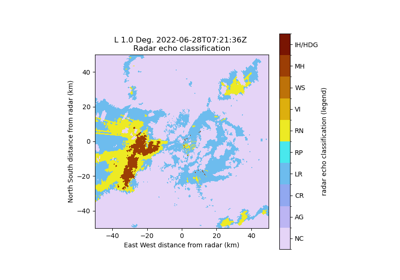
sphx_glr_examples_retrieve_plot_hydrometeor.py
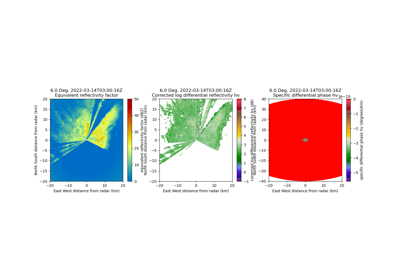
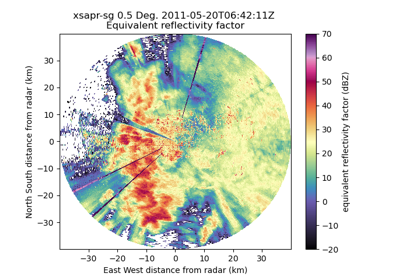
sphx_glr_examples_retrieve_plot_hydrometeor_class_x_band.py
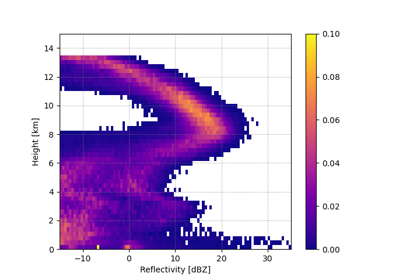
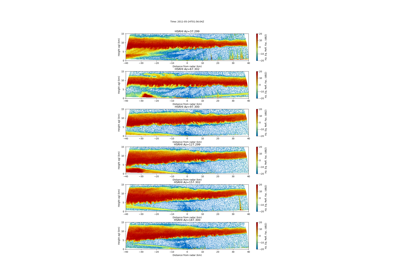
sphx_glr_examples_retrieve_plot_cfad.py
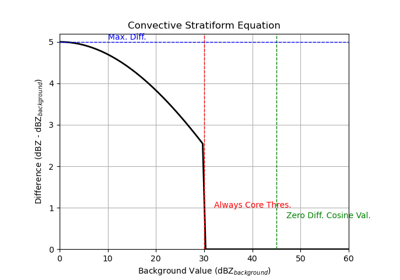
sphx_glr_examples_retrieve_plot_convective_stratiform.py
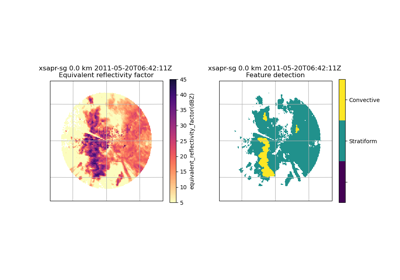
sphx_glr_examples_retrieve_plot_feature_detection.py
Xradar Examples#
Examples of using Xradar with Py-ART to accomplish different tasks.
sphx_glr_examples_xradar_plot_xradar.py
sphx_glr_examples_xradar_plot_grid_xradar.py
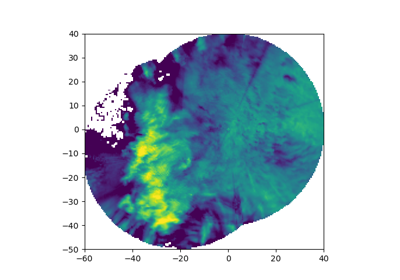
sphx_glr_examples_xradar_plot_dealias_xradar.py